Featurization Model Selection and Tuning
Overview
The data contains features extracted from the silhouette of vehicles in different angles. The purpose is to classify a given silhouette as one of three types of vehicle, using a set of features extracted from the silhouette. The vehicle may be viewed from one of many different angles.
Solution
Importing Necessary libraries
 1# NumPy: For mathematical funcations, array, matrices operations
 2import numpy as np
 3
 4# Graph: Plotting graphs and other visula tools
 5import pandas as pd
 6import seaborn as sns
 7
 8sns.set(color_codes=True)
 9
10#To enable inline plotting graphs
11import matplotlib.pyplot as plt
12%matplotlib inline
13
14# Disable warning
15import warnings
16warnings.filterwarnings("ignore")
Load Data
 1# Load data set
 2# Import CSV data using pandas data frame
 3df_original = pd.read_csv('concrete.csv')
 4
 5# Print total columns
 6print("Total Colums in dataframe: ", len(df_original.columns))
 7
 8# Prepare columns names
 9df_original_columns = []
10for column in df_original.columns:
11    df_original_columns.append(column)
12
13
14
15print("Columns list {}".format(df_original_columns))
16print("***********************************************************************************************************************")
17
18# Prepare mapping of column names for quick access
19df_original_columns_map = {}
20map_index: int = 0
21for column in df_original_columns:
22    df_original_columns_map[map_index] = column
23    map_index = map_index + 1
24
25print("Columns Map {}".format(df_original_columns_map))
Total Colums in dataframe:  9
Columns list ['cement', 'slag', 'ash', 'water', 'superplastic', 'coarseagg', 'fineagg', 'age', 'strength']
***********************************************************************************************************************
Columns Map {0: 'cement', 1: 'slag', 2: 'ash', 3: 'water', 4: 'superplastic', 5: 'coarseagg', 6: 'fineagg', 7: 'age', 8: 'strength'}
Data Pre-Processing
Data Shape
1df_original.shape
(1030, 9)
Data Info
1df_original.info()
2# All row items are numeric in nature, hence no label encoding is required
<class 'pandas.core.frame.DataFrame'>
RangeIndex: 1030 entries, 0 to 1029
Data columns (total 9 columns):
 #   Column        Non-Null Count  Dtype
---  ------        --------------  -----
 0   cement        1030 non-null   float64
 1   slag          1030 non-null   float64
 2   ash           1030 non-null   float64
 3   water         1030 non-null   float64
 4   superplastic  1030 non-null   float64
 5   coarseagg     1030 non-null   float64
 6   fineagg       1030 non-null   float64
 7   age           1030 non-null   int64
 8   strength      1030 non-null   float64
dtypes: float64(8), int64(1)
memory usage: 72.5 KB
Data
1df_original.head(16)
| cement | slag | ash | water | superplastic | coarseagg | fineagg | age | strength | |
|---|---|---|---|---|---|---|---|---|---|
| 0 | 141.3 | 212.0 | 0.0 | 203.5 | 0.0 | 971.8 | 748.5 | 28 | 29.89 |
| 1 | 168.9 | 42.2 | 124.3 | 158.3 | 10.8 | 1080.8 | 796.2 | 14 | 23.51 |
| 2 | 250.0 | 0.0 | 95.7 | 187.4 | 5.5 | 956.9 | 861.2 | 28 | 29.22 |
| 3 | 266.0 | 114.0 | 0.0 | 228.0 | 0.0 | 932.0 | 670.0 | 28 | 45.85 |
| 4 | 154.8 | 183.4 | 0.0 | 193.3 | 9.1 | 1047.4 | 696.7 | 28 | 18.29 |
| 5 | 255.0 | 0.0 | 0.0 | 192.0 | 0.0 | 889.8 | 945.0 | 90 | 21.86 |
| 6 | 166.8 | 250.2 | 0.0 | 203.5 | 0.0 | 975.6 | 692.6 | 7 | 15.75 |
| 7 | 251.4 | 0.0 | 118.3 | 188.5 | 6.4 | 1028.4 | 757.7 | 56 | 36.64 |
| 8 | 296.0 | 0.0 | 0.0 | 192.0 | 0.0 | 1085.0 | 765.0 | 28 | 21.65 |
| 9 | 155.0 | 184.0 | 143.0 | 194.0 | 9.0 | 880.0 | 699.0 | 28 | 28.99 |
| 10 | 151.8 | 178.1 | 138.7 | 167.5 | 18.3 | 944.0 | 694.6 | 28 | 36.35 |
| 11 | 173.0 | 116.0 | 0.0 | 192.0 | 0.0 | 946.8 | 856.8 | 3 | 6.94 |
| 12 | 385.0 | 0.0 | 0.0 | 186.0 | 0.0 | 966.0 | 763.0 | 14 | 27.92 |
| 13 | 237.5 | 237.5 | 0.0 | 228.0 | 0.0 | 932.0 | 594.0 | 7 | 26.26 |
| 14 | 167.0 | 187.0 | 195.0 | 185.0 | 7.0 | 898.0 | 636.0 | 28 | 23.89 |
| 15 | 213.8 | 98.1 | 24.5 | 181.7 | 6.7 | 1066.0 | 785.5 | 100 | 49.97 |
Data Description
1df_original.describe().T
| count | mean | std | min | 25% | 50% | 75% | max | |
|---|---|---|---|---|---|---|---|---|
| cement | 1030.0 | 281.167864 | 104.506364 | 102.00 | 192.375 | 272.900 | 350.000 | 540.0 |
| slag | 1030.0 | 73.895825 | 86.279342 | 0.00 | 0.000 | 22.000 | 142.950 | 359.4 |
| ash | 1030.0 | 54.188350 | 63.997004 | 0.00 | 0.000 | 0.000 | 118.300 | 200.1 |
| water | 1030.0 | 181.567282 | 21.354219 | 121.80 | 164.900 | 185.000 | 192.000 | 247.0 |
| superplastic | 1030.0 | 6.204660 | 5.973841 | 0.00 | 0.000 | 6.400 | 10.200 | 32.2 |
| coarseagg | 1030.0 | 972.918932 | 77.753954 | 801.00 | 932.000 | 968.000 | 1029.400 | 1145.0 |
| fineagg | 1030.0 | 773.580485 | 80.175980 | 594.00 | 730.950 | 779.500 | 824.000 | 992.6 |
| age | 1030.0 | 45.662136 | 63.169912 | 1.00 | 7.000 | 28.000 | 56.000 | 365.0 |
| strength | 1030.0 | 35.817961 | 16.705742 | 2.33 | 23.710 | 34.445 | 46.135 | 82.6 |
Checking for Missing value, duplicate data, incorrect data and perform data cleansing
Empty NA Values
1df_original.isna().sum()
2# No null values are present in data
cement          0
slag            0
ash             0
water           0
superplastic    0
coarseagg       0
fineagg         0
age             0
strength        0
dtype: int64
Duplicates
 1df_duplicates = df_original.duplicated()
 2
 3print('Number of duplicate rows = {}'.format(df_duplicates.sum()))
 4
 5# 25 duplicates
 6
 7# We are not modyfying original dataframe instead our all operations
 8# will be on `df_main`
 9df_main = df_original.drop_duplicates()
10
11df_main.shape
Number of duplicate rows = 25

(1005, 9)
Pearson Correlation
1df_main.corr(method ='pearson')
2# Eg. Present of cement, superplastic and more value of age result more strength of the mixture
| cement | slag | ash | water | superplastic | coarseagg | fineagg | age | strength | |
|---|---|---|---|---|---|---|---|---|---|
| cement | 1.000000 | -0.303324 | -0.385610 | -0.056625 | 0.060906 | -0.086205 | -0.245375 | 0.086348 | 0.488283 |
| slag | -0.303324 | 1.000000 | -0.312352 | 0.130262 | 0.019800 | -0.277559 | -0.289685 | -0.042759 | 0.103374 |
| ash | -0.385610 | -0.312352 | 1.000000 | -0.283314 | 0.414213 | -0.026468 | 0.090262 | -0.158940 | -0.080648 |
| water | -0.056625 | 0.130262 | -0.283314 | 1.000000 | -0.646946 | -0.212480 | -0.444915 | 0.279284 | -0.269624 |
| superplastic | 0.060906 | 0.019800 | 0.414213 | -0.646946 | 1.000000 | -0.241721 | 0.207993 | -0.194076 | 0.344209 |
| coarseagg | -0.086205 | -0.277559 | -0.026468 | -0.212480 | -0.241721 | 1.000000 | -0.162187 | -0.005264 | -0.144717 |
| fineagg | -0.245375 | -0.289685 | 0.090262 | -0.444915 | 0.207993 | -0.162187 | 1.000000 | -0.156572 | -0.186448 |
| age | 0.086348 | -0.042759 | -0.158940 | 0.279284 | -0.194076 | -0.005264 | -0.156572 | 1.000000 | 0.337367 |
| strength | 0.488283 | 0.103374 | -0.080648 | -0.269624 | 0.344209 | -0.144717 | -0.186448 | 0.337367 | 1.000000 |
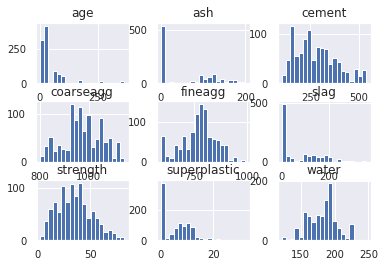
Body of Distribution
1df_main.hist(bins=20, xlabelsize=10, ylabelsize=10)
2# We can see that data is not distributed properly and there are tails present on either side of gaussian curve
array([[<matplotlib.axes._subplots.AxesSubplot object at 0x7faef7133a50>,
        <matplotlib.axes._subplots.AxesSubplot object at 0x7faef68cf990>,
        <matplotlib.axes._subplots.AxesSubplot object at 0x7faef688dd10>],
       [<matplotlib.axes._subplots.AxesSubplot object at 0x7faef68419d0>,
        <matplotlib.axes._subplots.AxesSubplot object at 0x7faef67fed50>,
        <matplotlib.axes._subplots.AxesSubplot object at 0x7faef67b2a10>],
       [<matplotlib.axes._subplots.AxesSubplot object at 0x7faef6772e90>,
        <matplotlib.axes._subplots.AxesSubplot object at 0x7faef67a6a50>,
        <matplotlib.axes._subplots.AxesSubplot object at 0x7faef67315d0>]],
      dtype=object)
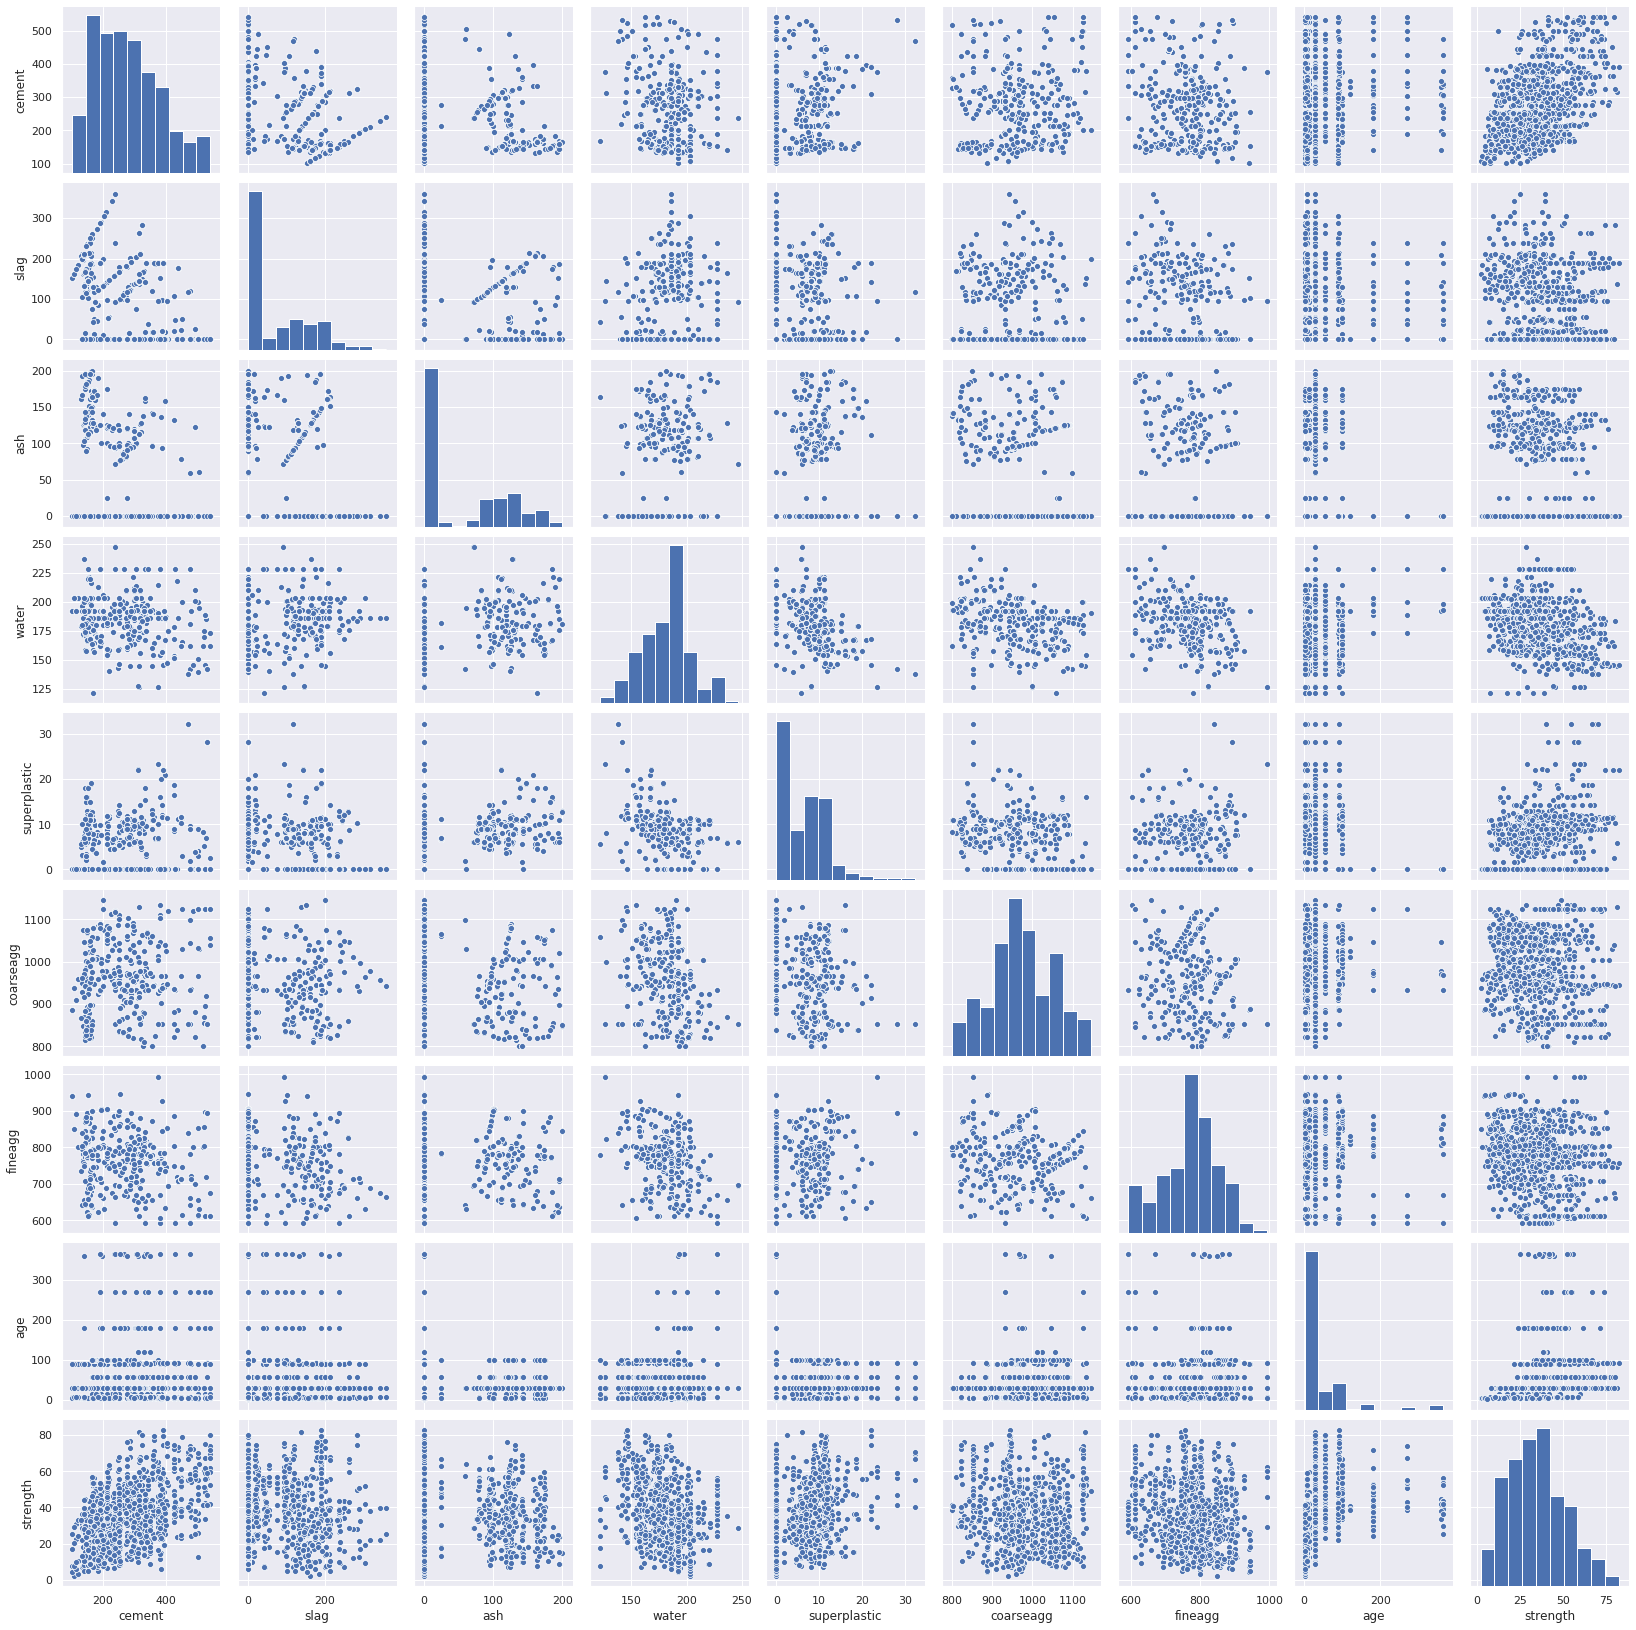
Pairplot
1sns.pairplot(df_main)
2# We do not see any positive curve or negative curve but there is a cloud
3# which indicates the presence of cement add strength though not direct relation
<seaborn.axisgrid.PairGrid at 0x7faef6441c90>
Evaluation of different models
  1from sklearn.model_selection import cross_val_score
  2from sklearn.model_selection import train_test_split
  3from sklearn.pipeline import Pipeline
  4from sklearn.model_selection import KFold, GridSearchCV, RandomizedSearchCV
  5from sklearn.preprocessing import MinMaxScaler
  6from sklearn.linear_model import LinearRegression, Ridge,Lasso
  7from sklearn.neighbors import KNeighborsRegressor
  8from sklearn.ensemble import AdaBoostRegressor, ExtraTreesRegressor, RandomForestRegressor, GradientBoostingRegressor
  9from sklearn.tree import DecisionTreeRegressor
 10
 11
 12class ModelEvaluator:
 13
 14    def __init__(self, dataFrame):
 15        self.dataFrame = dataFrame
 16        self.modelResullt = {}
 17        self.algorithms = {
 18            "linearRegression" :  LinearRegression(),
 19            "lasso" :  Lasso(),
 20            "ridge" :  Ridge(),
 21            "adaBoostRegressor" : AdaBoostRegressor(),
 22            "extraTreeRegressor" :  ExtraTreesRegressor(),
 23            "randomForestRegressor" : RandomForestRegressor(),
 24            "gradientBoostRegressor" : GradientBoostingRegressor(),
 25            "decisionTreeRegressor" : DecisionTreeRegressor(),
 26            "knnRegressor" : KNeighborsRegressor()
 27        }
 28
 29    def printDf_X(self):
 30        print(self.df_X)
 31
 32    def printDf_Y(self):
 33        print(self.df_Y)
 34
 35    def splitData(self):
 36        print("Splitting data into train ,test and validation")
 37        test_size = 0.2
 38        seed = 29
 39        self.df_X = self.dataFrame.copy().drop(['strength'], axis = 1)
 40        self.df_Y = self.dataFrame['strength']
 41
 42        self.X_train, self.X_test, self.y_train, self.y_test = \
 43            train_test_split(self.df_X, self.df_Y, test_size=test_size, random_state=seed)
 44
 45        self.X_train, self.X_val, self.y_train, self.y_val = \
 46            train_test_split(self.df_X, self.df_Y, test_size=test_size, random_state=seed)
 47
 48
 49    def runSimplePipelines(self):
 50        print("Running simple pipelines")
 51
 52        self.decentModels  = {}
 53
 54        for item in self.algorithms:
 55            # Init pipe
 56            itemPipe = Pipeline([("scaler", MinMaxScaler()), (item, self.algorithms[item])])
 57
 58            #fit data
 59            itemPipe.fit(self.X_train, self.y_train)
 60
 61            print ("**********   {}   ************".format(item))
 62
 63            print("")
 64            score  = itemPipe.score(self.X_test, self.y_test)
 65            print("Test score is {:.2f}". format(score))
 66            print("")
 67
 68            cross_val = cross_val_score(self.algorithms[item], self.X_train, self.y_train)
 69            cross_val = cross_val.ravel()
 70            print ("cross validatioion score")
 71            print ("cv-mean :",cross_val.mean())
 72            print ("cv-std  :",cross_val.std())
 73            print ("cv-max  :",cross_val.max())
 74            print ("cv-min  :",cross_val.min())
 75            print("")
 76
 77            # We aree considering 0.85 s the minim score we need for our prediction
 78            if score >= 0.85:
 79                self.decentModels[item] = score
 80
 81    def printDecentModels(self):
 82        print("Top performing models are: ")
 83        for topModel in self.decentModels:
 84            print("{} score {}".format(topModel, self.decentModels[topModel]))
 85
 86    def deecentModels(self):
 87        return selff.decentModels
 88
 89    def runGridSearchCV_HyperParameterTuningPipelines(self, param1, param2):
 90        print("Running gridsearch cv hyper parameter pipelines")
 91        for topModel in self.decentModels:
 92
 93            # Init pipe
 94            regressor = self.algorithms[topModel]
 95
 96            itemPipe = Pipeline([("scaler", MinMaxScaler()), (topModel, regressor)])
 97
 98            if topModel == 'extraTreeRegressor' or topModel == 'randomForestRegressor':
 99
100                gsCv = GridSearchCV(estimator = regressor, param_grid = param1,
101                              cv = 3, n_jobs = 1, verbose = 0, return_train_score=True)
102                #fit data
103                gsCv.fit(self.X_train, self.y_train)
104
105                print ("**********   {}   ************".format(topModel))
106
107                print("")
108
109                print("Best parameter {} ".format(gsCv.best_params_))
110
111                best_grid = gsCv.best_estimator_
112
113                score = best_grid.score(self.X_val, self.y_val)
114
115                print("Best score is {} ".format(score))
116            elif topModel == 'decisionTreeRegressor':
117                gsCv = GridSearchCV(estimator = regressor, param_grid = param2,
118                              cv = 3, n_jobs = 1, verbose = 0, return_train_score=True)
119                #fit data
120                gsCv.fit(self.X_train, self.y_train)
121
122                print ("**********   {}   ************".format(topModel))
123
124                print("")
125
126                print("Best parameter {} ".format(gsCv.best_params_))
127
128                best_grid = gsCv.best_estimator_
129
130                score = best_grid.score(self.X_val, self.y_val)
131
132                print("Best score is {} ".format(score))
133
134
135    def runRandomSearchCV_HyperParameterTuningPipelines(self, param1, param2):
136        print("Running randomsearch cv hyper parameter pipelines")
137        for topModel in self.decentModels:
138            print("")
139            print ("**********   {}   ************".format(topModel))
140
141            # Init pipe
142            regressor = self.algorithms[topModel]
143
144            itemPipe = Pipeline([("scaler", MinMaxScaler()), (topModel, regressor)])
145
146            if topModel == 'extraTreeRegressor' or topModel == 'randomForestRegressor':
147
148                randCv = RandomizedSearchCV(estimator = regressor, param_distributions = param1,
149                              cv = 3, n_jobs = 1, verbose = 0, return_train_score=True)
150                #fit data
151                randCv.fit(self.X_train, self.y_train)
152
153
154                print("Best parameter {} ".format(randCv.best_params_))
155
156                best_random = randCv.best_estimator_
157
158                score = best_random.score(self.X_val, self.y_val)
159
160                print("Best score is {} ".format(score))
161
162            elif topModel == 'gradientBoostRegressor':
163                randCv = RandomizedSearchCV(estimator = regressor, param_distributions = param2,
164                              cv = 3, n_jobs = 1, verbose = 0, return_train_score=True)
165                #fit data
166                randCv.fit(self.X_train, self.y_train)
167
168                print("Best parameter {} ".format(randCv.best_params_))
169
170                best_random = randCv.best_estimator_
171
172                score = best_random.score(self.X_val, self.y_val)
173                print("Best score is {} ".format(score))
174
175
 1# Instantiation of Class
 2modelEvaluator = ModelEvaluator(df_main)
 3
 4# Splitting data in train, test, validation
 5modelEvaluator.splitData()
 6
 7# Print Data X
 8# modelEvaluator.printDf_X()
 9
10# Print Data Y
11
12#modelEvaluator.printDf_Y()
Splitting data into train ,test and validation
Run Pipelines
1# run simple pipelines
2
3modelEvaluator.runSimplePipelines()
Running simple pipelines
**********   linearRegression   ************

Test score is 0.61

cross validatioion score
cv-mean : 0.5814937255975108
cv-std  : 0.06146956560114513
cv-max  : 0.6549569865710905
cv-min  : 0.4825048517025202

**********   lasso   ************

Test score is 0.18

cross validatioion score
cv-mean : 0.5813839462037981
cv-std  : 0.06102069720851994
cv-max  : 0.6550985629358492
cv-min  : 0.48262897974523195

**********   ridge   ************

Test score is 0.61

cross validatioion score
cv-mean : 0.5814938391690567
cv-std  : 0.06146940364558386
cv-max  : 0.654957330984628
cv-min  : 0.48250514279718304

**********   adaBoostRegressor   ************

Test score is 0.79

cross validatioion score
cv-mean : 0.7800716089672267
cv-std  : 0.019490295991580992
cv-max  : 0.7994746066655304
cv-min  : 0.7477560683539344

**********   extraTreeRegressor   ************

Test score is 0.92

cross validatioion score
cv-mean : 0.895111981820915
cv-std  : 0.0234640915273316
cv-max  : 0.9174866722767857
cv-min  : 0.8521969986100624

**********   randomForestRegressor   ************

Test score is 0.91

cross validatioion score
cv-mean : 0.8875629270273377
cv-std  : 0.022124577367158674
cv-max  : 0.9035613442825255
cv-min  : 0.8453962100132185

**********   gradientBoostRegressor   ************

Test score is 0.91

cross validatioion score
cv-mean : 0.8839800036476907
cv-std  : 0.02452673305433398
cv-max  : 0.9140544186904889
cv-min  : 0.8538996260972368

**********   decisionTreeRegressor   ************

Test score is 0.78

cross validatioion score
cv-mean : 0.8056426060069135
cv-std  : 0.0222669686539792
cv-max  : 0.8370426378836642
cv-min  : 0.7780716563023613

**********   knnRegressor   ************

Test score is 0.66

cross validatioion score
cv-mean : 0.6436772448865766
cv-std  : 0.03344162192431788
cv-max  : 0.6893663835880288
cv-min  : 0.6067558661871446
Top Performing models
1#print deceent models
2modelEvaluator.printDecentModels()
Top performing models are:
extraTreeRegressor score 0.924243991305789
randomForestRegressor score 0.9140009203234163
gradientBoostRegressor score 0.914941707121063
Hyper Parameter Tuning
Hyper parameters for top models
 1for topModel in modelEvaluator.decentModels:
 2    model = modelEvaluator.algorithms[topModel]
 3    print("")
 4    print("***************************")
 5    print(" Model {} ".format(topModel))
 6    print(model.get_params())
 7    print("***************************")
 8    print("")
 9
10# We see all regressor has ~similar attributes hence we shall
11# use same cutomizing parameters for them
***************************
 Model extraTreeRegressor
{'bootstrap': False, 'ccp_alpha': 0.0, 'criterion': 'mse', 'max_depth': None, 'max_features': 'auto', 'max_leaf_nodes': None, 'max_samples': None, 'min_impurity_decrease': 0.0, 'min_impurity_split': None, 'min_samples_leaf': 1, 'min_samples_split': 2, 'min_weight_fraction_leaf': 0.0, 'n_estimators': 100, 'n_jobs': None, 'oob_score': False, 'random_state': None, 'verbose': 0, 'warm_start': False}
***************************


***************************
 Model randomForestRegressor
{'bootstrap': True, 'ccp_alpha': 0.0, 'criterion': 'mse', 'max_depth': None, 'max_features': 'auto', 'max_leaf_nodes': None, 'max_samples': None, 'min_impurity_decrease': 0.0, 'min_impurity_split': None, 'min_samples_leaf': 1, 'min_samples_split': 2, 'min_weight_fraction_leaf': 0.0, 'n_estimators': 100, 'n_jobs': None, 'oob_score': False, 'random_state': None, 'verbose': 0, 'warm_start': False}
***************************


***************************
 Model gradientBoostRegressor
{'alpha': 0.9, 'ccp_alpha': 0.0, 'criterion': 'friedman_mse', 'init': None, 'learning_rate': 0.1, 'loss': 'ls', 'max_depth': 3, 'max_features': None, 'max_leaf_nodes': None, 'min_impurity_decrease': 0.0, 'min_impurity_split': None, 'min_samples_leaf': 1, 'min_samples_split': 2, 'min_weight_fraction_leaf': 0.0, 'n_estimators': 100, 'n_iter_no_change': None, 'presort': 'deprecated', 'random_state': None, 'subsample': 1.0, 'tol': 0.0001, 'validation_fraction': 0.1, 'verbose': 0, 'warm_start': False}
***************************
General overview
GridSearch technique is an exhaustive searching technique for hyperparameters hence it is reelatively slower.
RandomSearch searches for optimal hyperemeter randomly hence it is quite fast.
Parameter Tuning
 1param_regressor = {
 2    'bootstrap': [True, False],
 3    'max_depth': [int(x) for x in np.linspace(5, 96, num = 2)],
 4    'max_features': ['auto', 'log2'],
 5    'min_samples_leaf': [1, 2, 4, 6, 8, 10, 12, 16, 32, 48],
 6    'min_samples_split': [2, 4, 6, 8, 10, 12, 15],
 7    'n_estimators': [int(x) for x in np.linspace(start = 2 , stop = 512, num = 2)]
 8}
 9
10param_gb_regressor = {
11    'max_depth': [int(x) for x in np.linspace(5, 96, num = 2)],
12    'max_features': ['auto', 'log2'],
13    'min_samples_leaf': [1, 2, 4, 6, 8, 10, 12, 16, 32, 48],
14    'min_samples_split': [2, 4, 6, 8, 10, 12, 15],
15    'n_estimators': [int(x) for x in np.linspace(start = 2 , stop = 512, num = 2)]
16}
RandomSearchCV
1modelEvaluator.runRandomSearchCV_HyperParameterTuningPipelines(param_regressor, param_gb_regressor)
Running randomsearch cv hyper parameter pipelines

**********   extraTreeRegressor   ************
Best parameter {'n_estimators': 512, 'min_samples_split': 2, 'min_samples_leaf': 6, 'max_features': 'auto', 'max_depth': 5, 'bootstrap': True}
Best score is 0.778791435146383

**********   randomForestRegressor   ************
Best parameter {'n_estimators': 512, 'min_samples_split': 4, 'min_samples_leaf': 8, 'max_features': 'log2', 'max_depth': 96, 'bootstrap': True}
Best score is 0.847613175720529

**********   gradientBoostRegressor   ************
Best parameter {'n_estimators': 512, 'min_samples_split': 8, 'min_samples_leaf': 4, 'max_features': 'log2', 'max_depth': 5}
Best score is 0.9511423708146253
GridSearchCV
1modelEvaluator.runGridSearchCV_HyperParameterTuningPipelines(param_regressor, param_gb_regressor)
Running gridsearch cv hyper parameter pipelines
**********   extraTreeRegressor   ************

Best parameter {'bootstrap': False, 'max_depth': 96, 'max_features': 'auto', 'min_samples_leaf': 1, 'min_samples_split': 4, 'n_estimators': 512}
Best score is 0.9242964126142897
**********   randomForestRegressor   ************

Best parameter {'bootstrap': False, 'max_depth': 96, 'max_features': 'log2', 'min_samples_leaf': 1, 'min_samples_split': 2, 'n_estimators': 512}
Best score is 0.9274128760044592
Conclusion
Initially, we applied available regression techniques which were available. Among them we found out the topmost model.
Using hyper paramter tuning we are able to get a boost in accuracy for from 0.2% to 0.4%
Data
Source Code
feature-engineering-solution.ipynb
comments powered by Disqus